Report Metrics
Total report metrics. (YouTube Video Views and Instagram Reel Plays and Instagram post Impression and Instagram Story Reach are included in Total Impressions.)

Total report metrics. (YouTube Video Views and Instagram Reel Plays and Instagram post Impression and Instagram Story Reach are included in Total Impressions.)
Impressions & Engagement for each social media channel.
Report: The Canoe Trip
Dates: 18 Aug. 2024
Who is this report for: This report is prepared for Travelbase to provide a detailed overview of the campaign results for The Canoe Trip in Sweden, executed by The Lone Drifters.
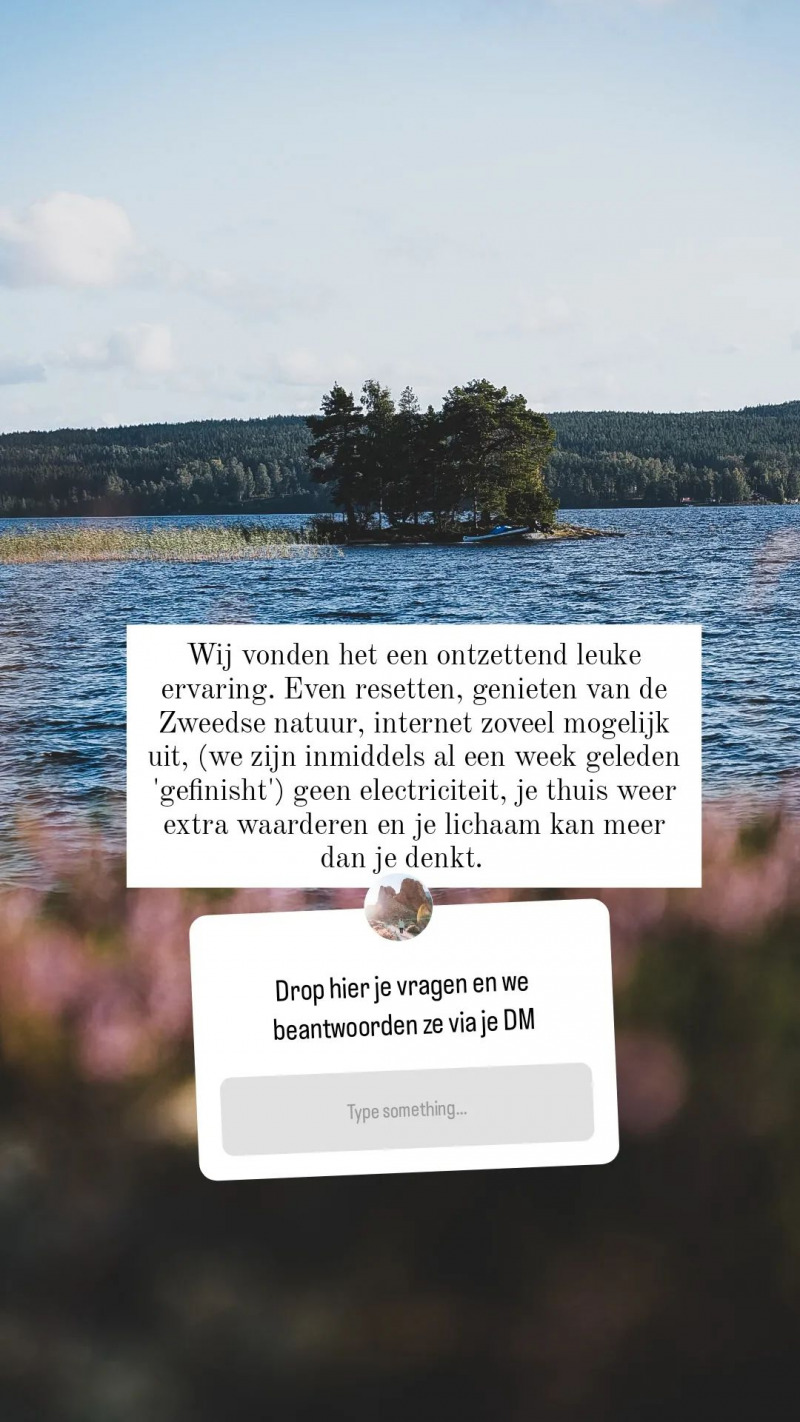
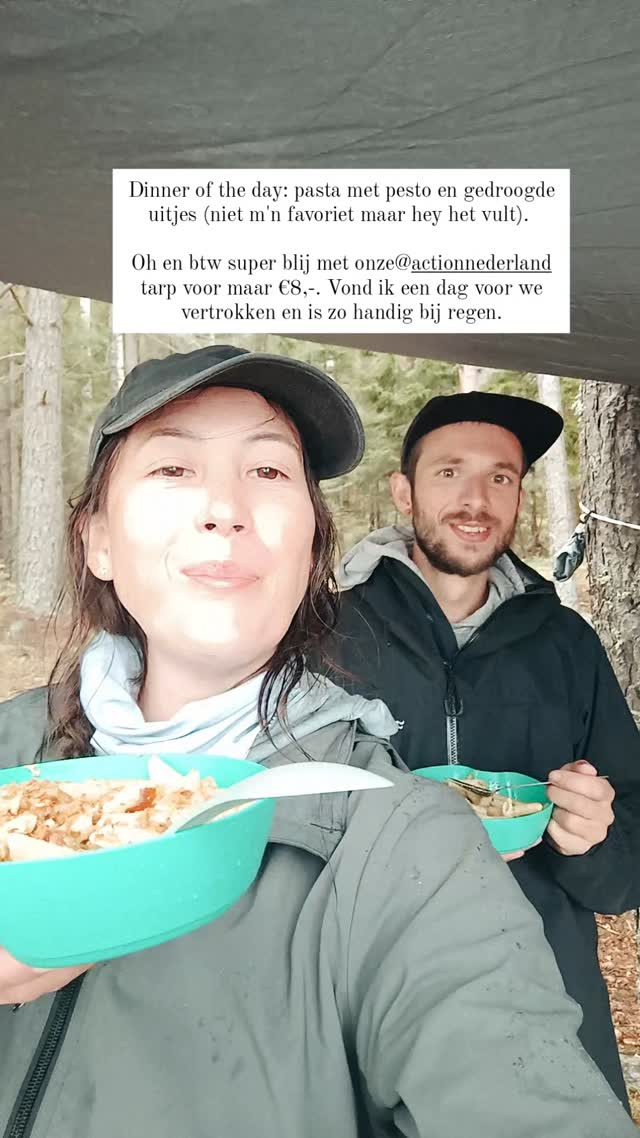
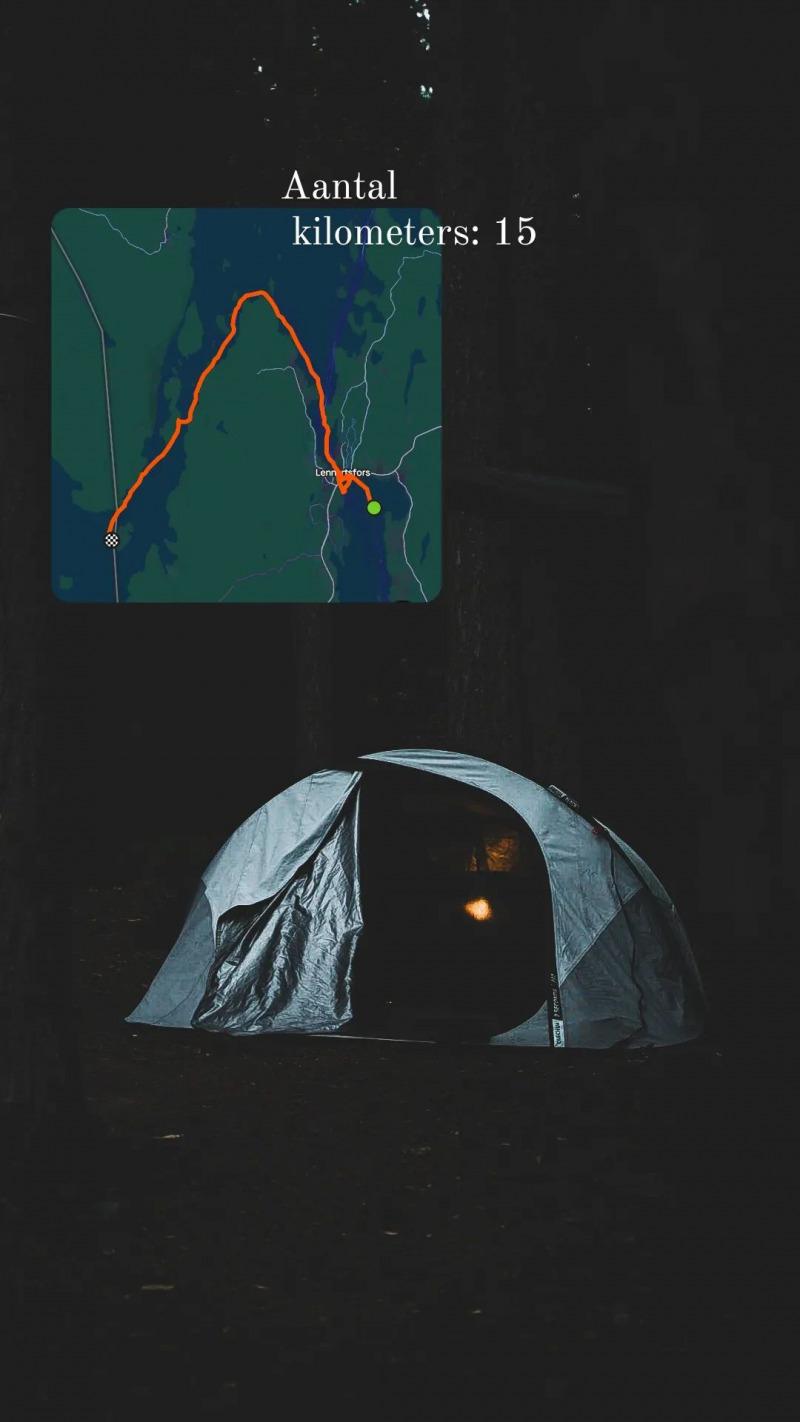
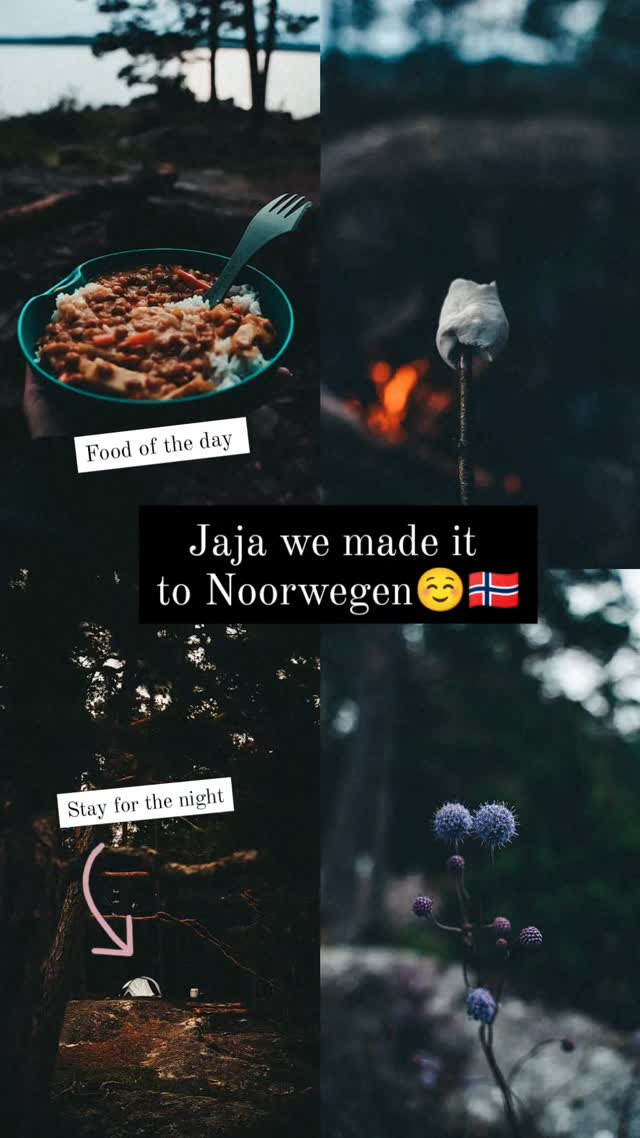
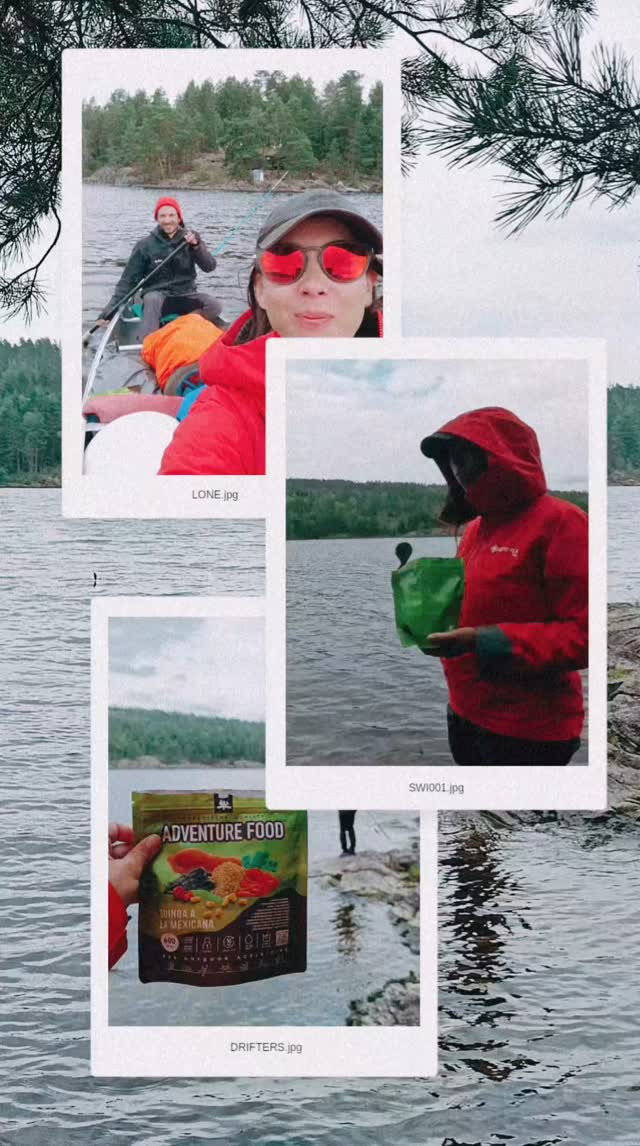
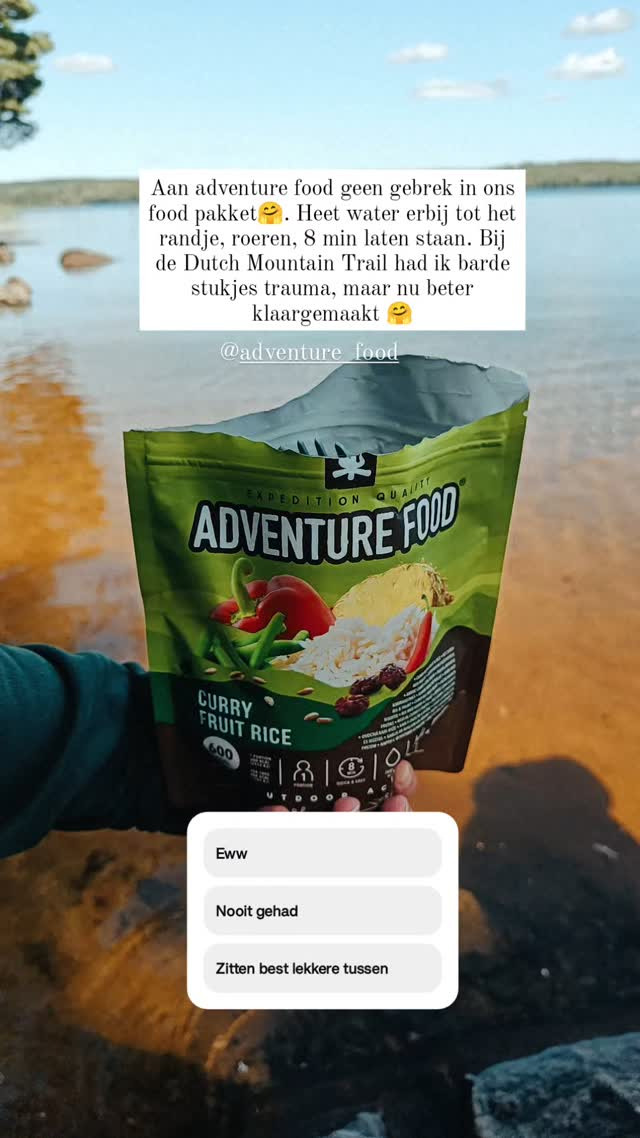
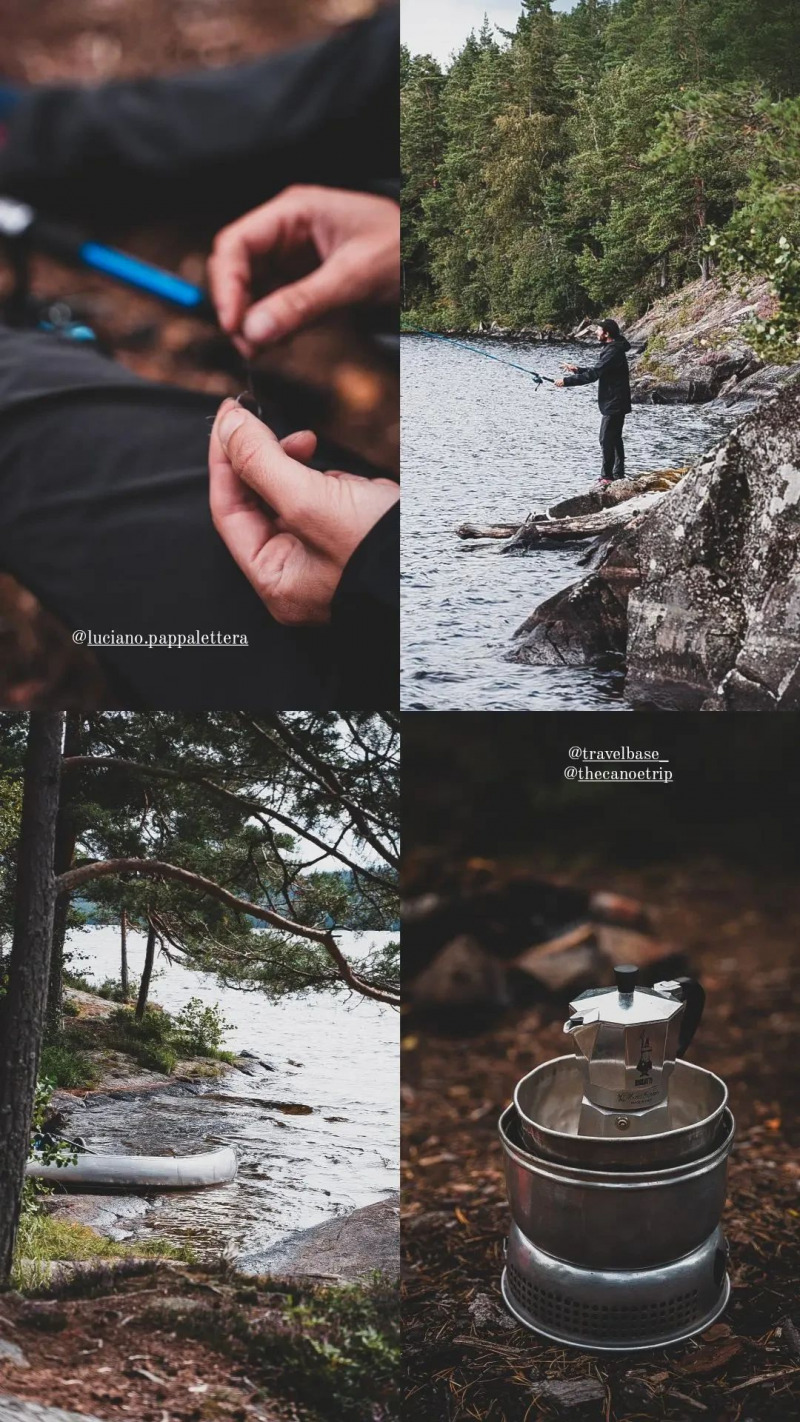
What was the campaign about: The campaign highlighted the immersive experience of a 7-day canoe expedition through the Swedish wilderness. We focused on the "reset" that nature provides, the adventure of wild camping, and the accessibility of the trip even for those without extensive rowing experience. The content was designed to move followers from initial inspiration to actual pre-registration for the next season.
Who is the target audience: The target audience consists of adventurous travelers, nature lovers, and outdoor enthusiasts looking for a unique, active getaway. We specifically targeted people who value slow travel, disconnecting from daily stress, and authentic outdoor experiences.
Content integration: This campaign was integrated into our broader outdoor and adventure category. By combining a long-form, SEO-optimized blog post with real-time storytelling, we ensured that the experience remains discoverable for future travelers. The blog post serves as a permanent guide for anyone searching for "kanotrektocht Zweden," linking directly to The Canoe Trip as the preferred partner.
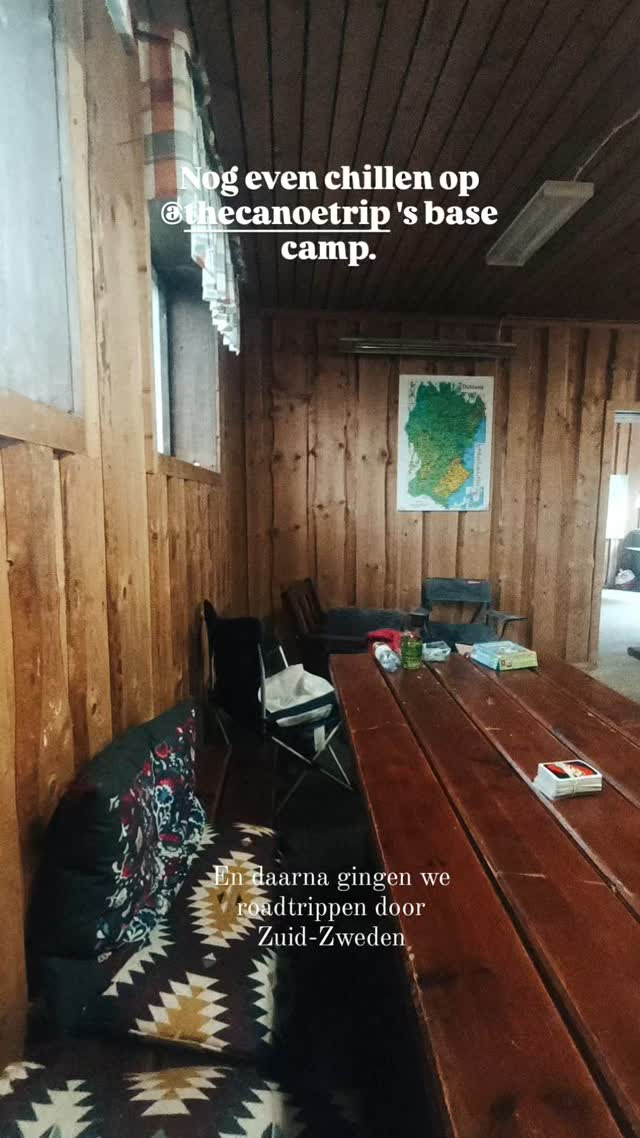
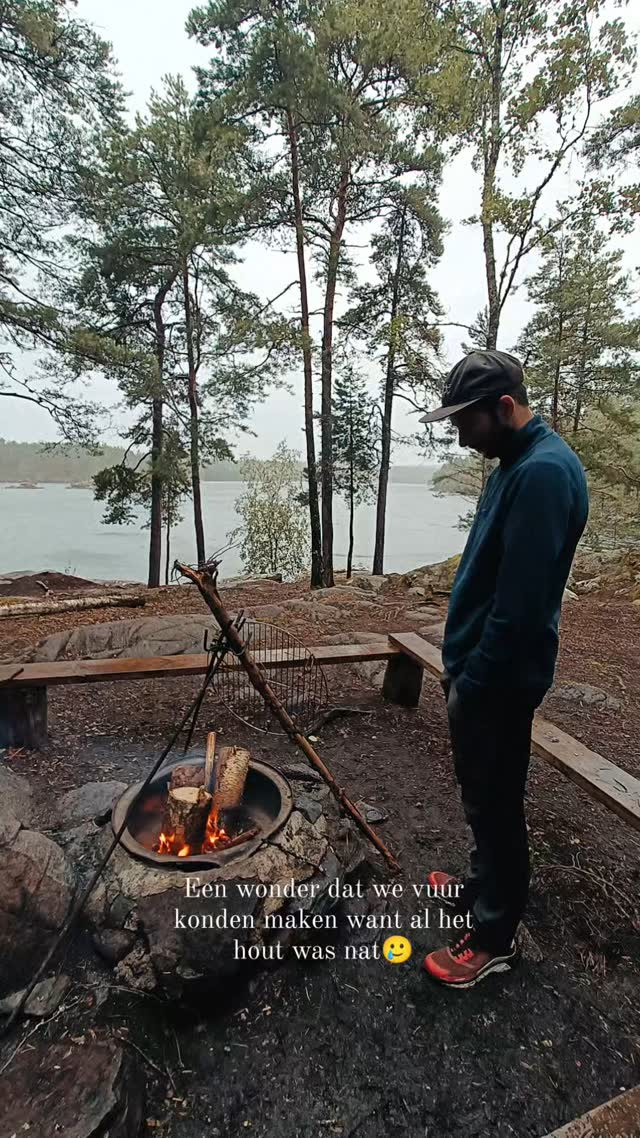
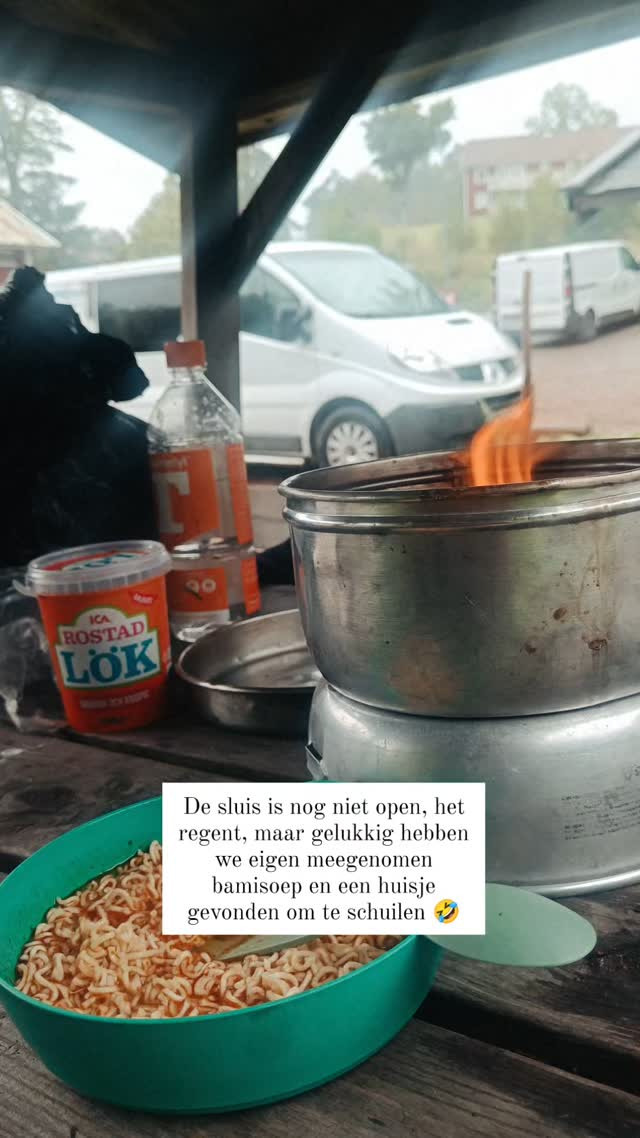
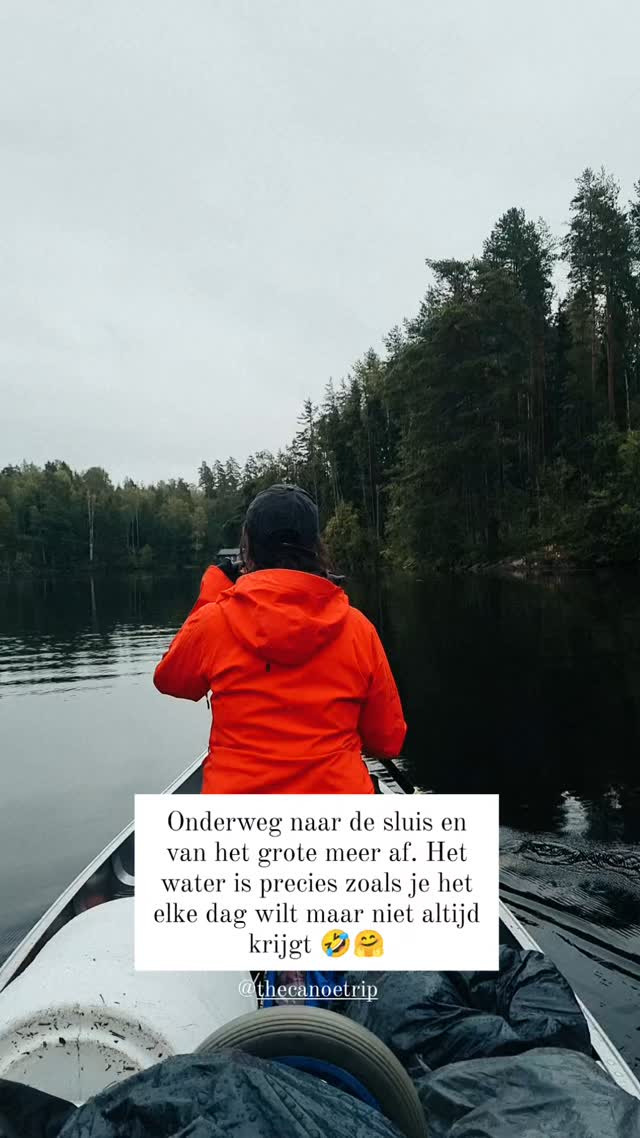
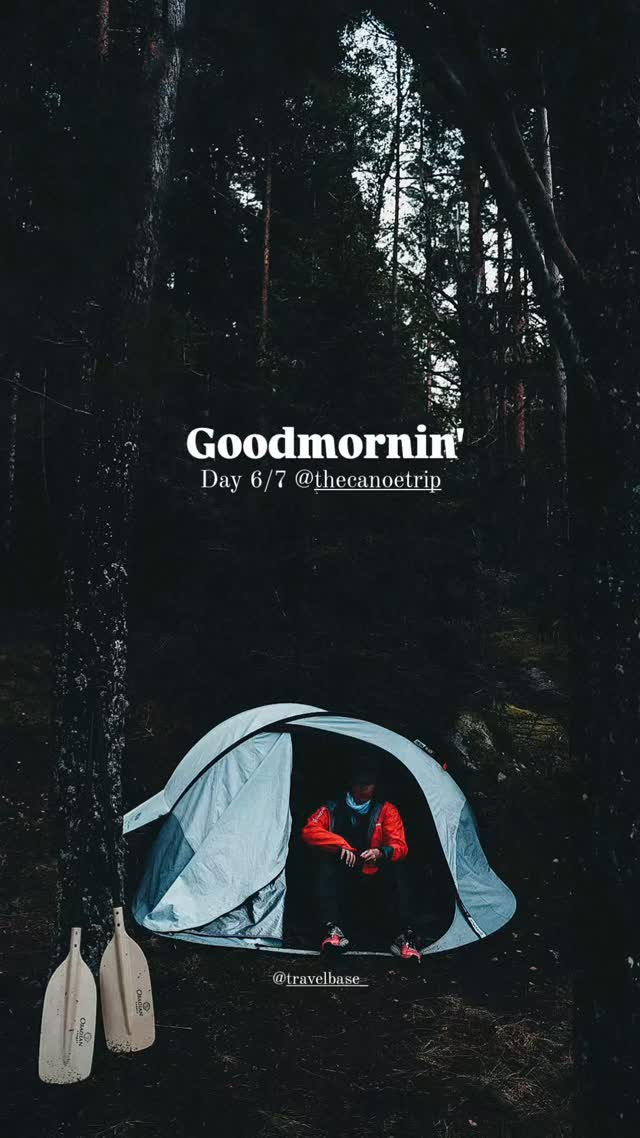
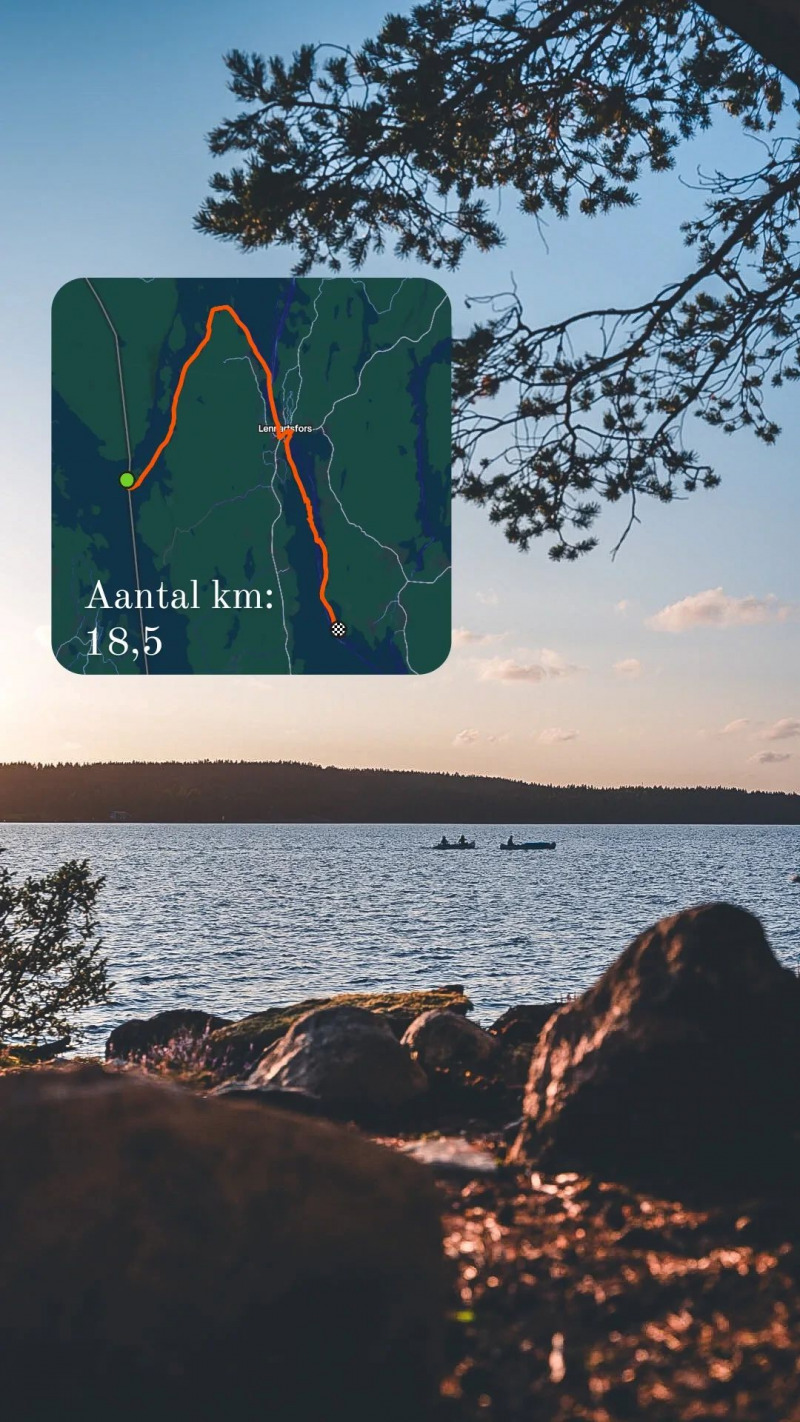
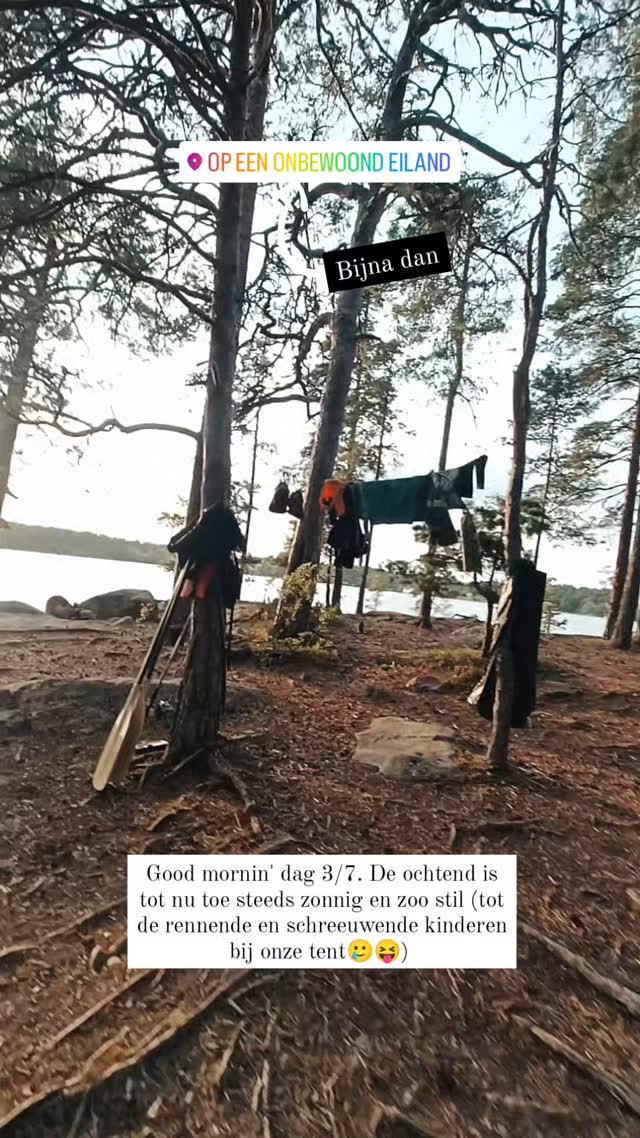
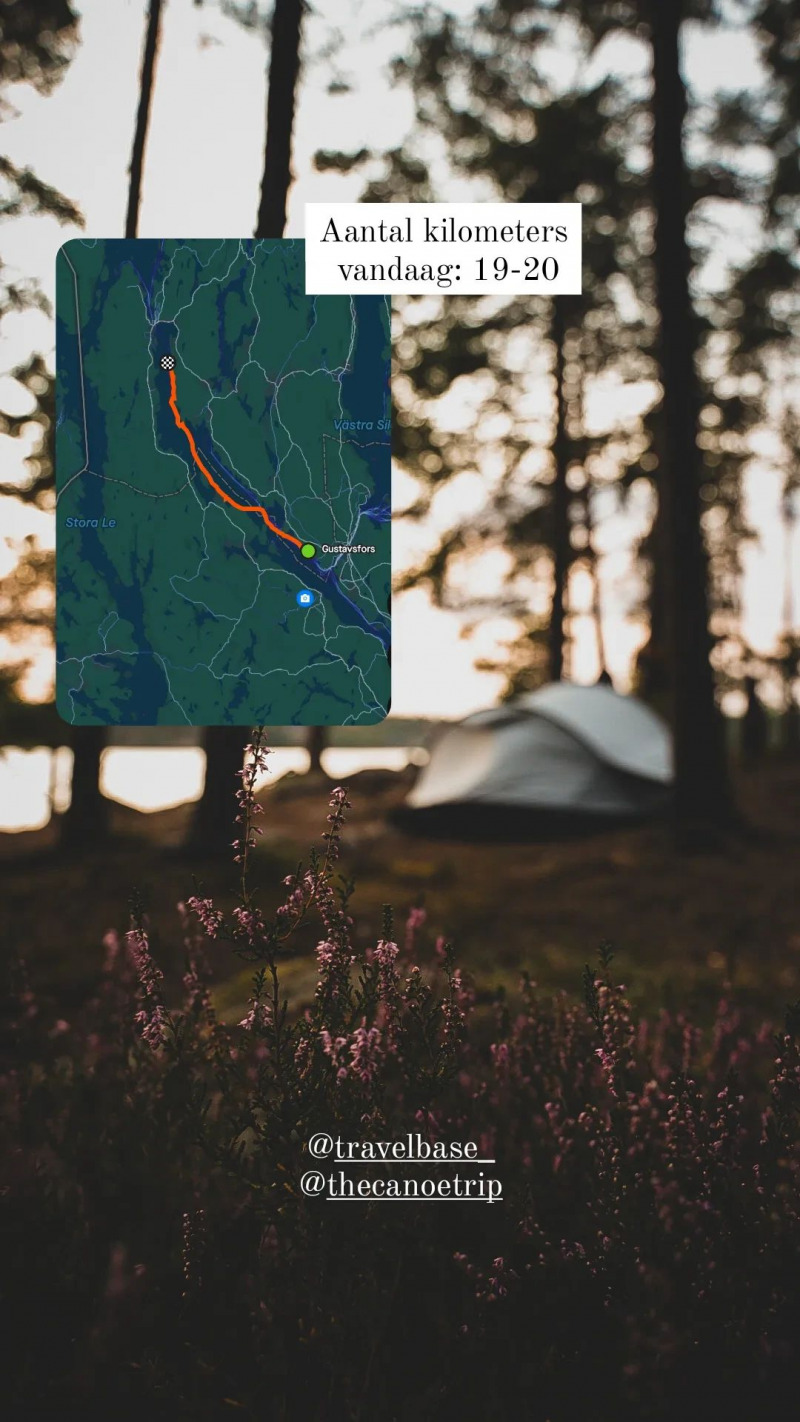
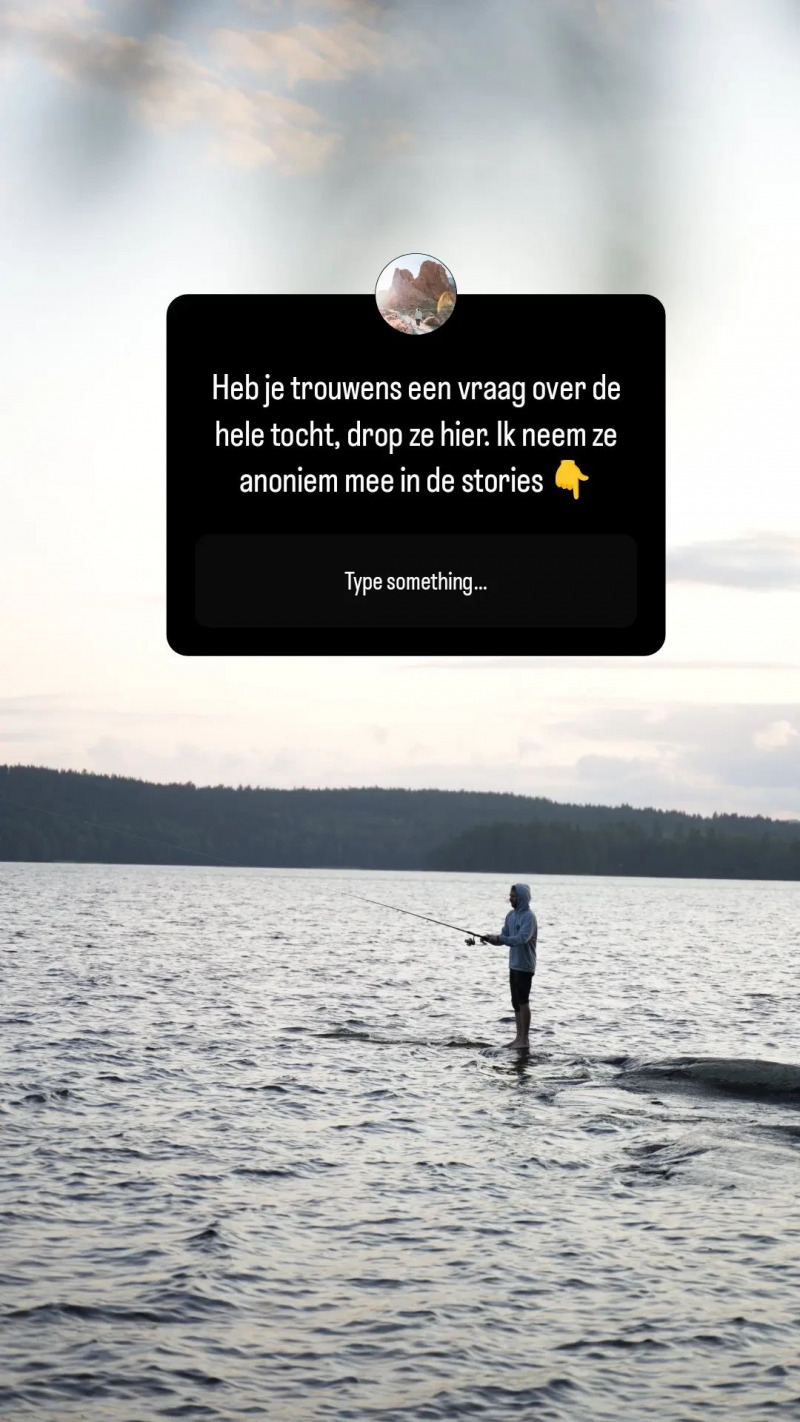
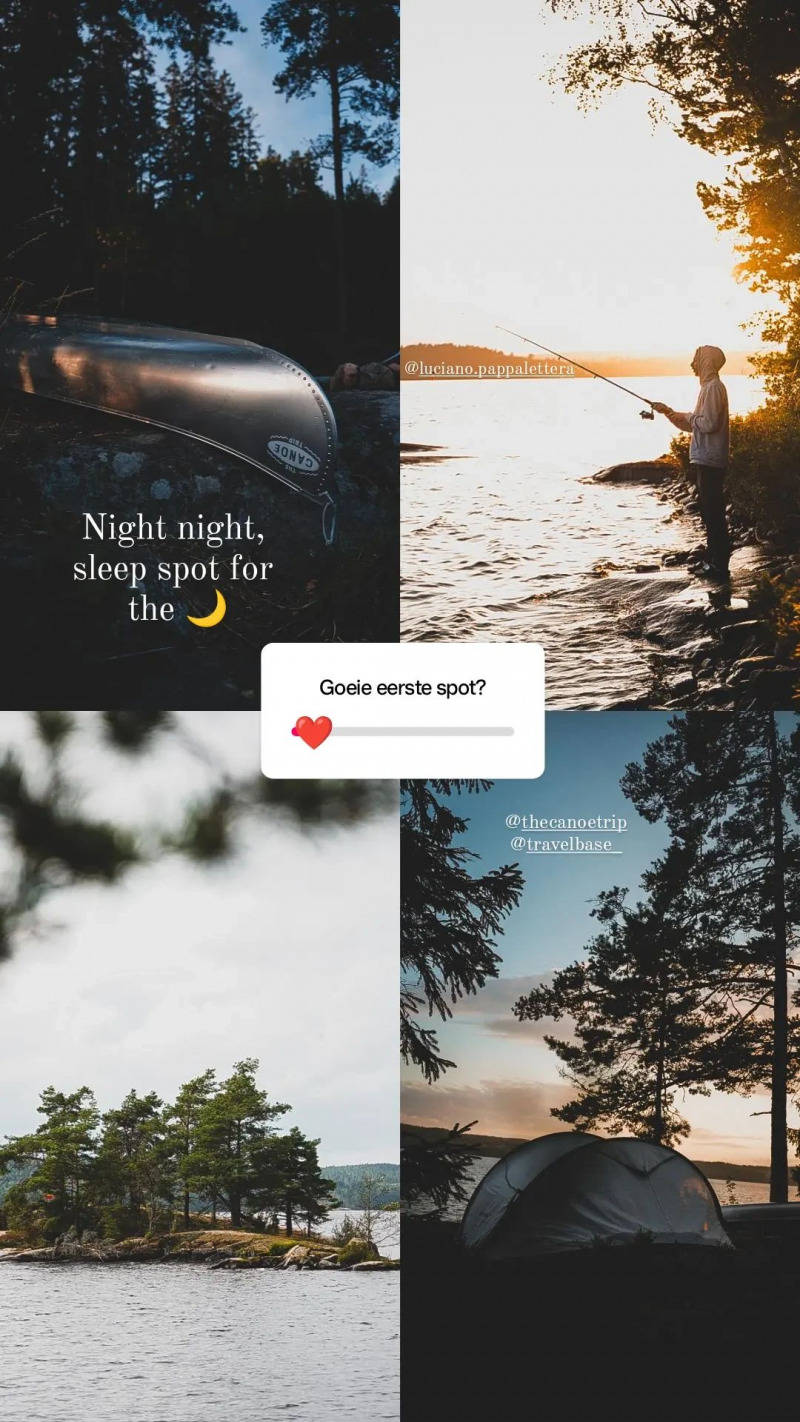
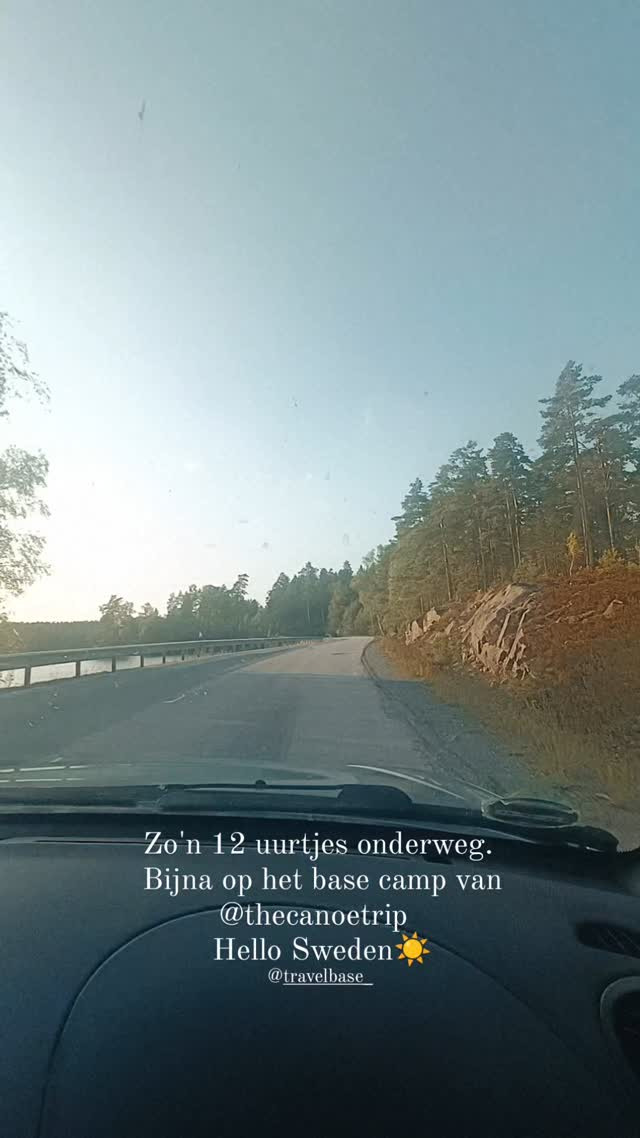
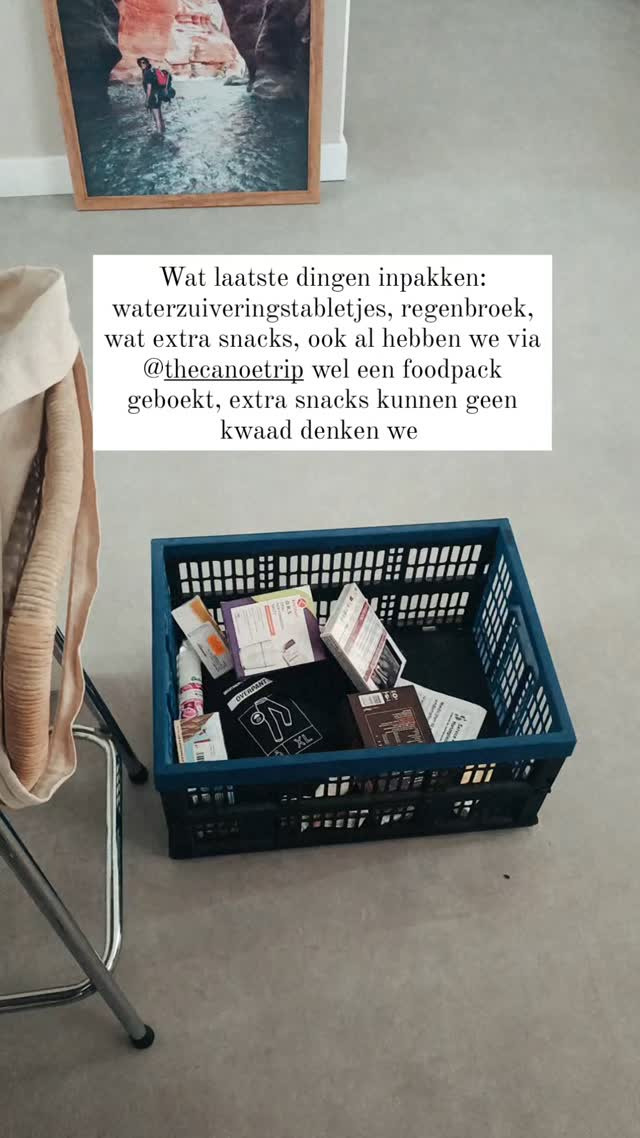
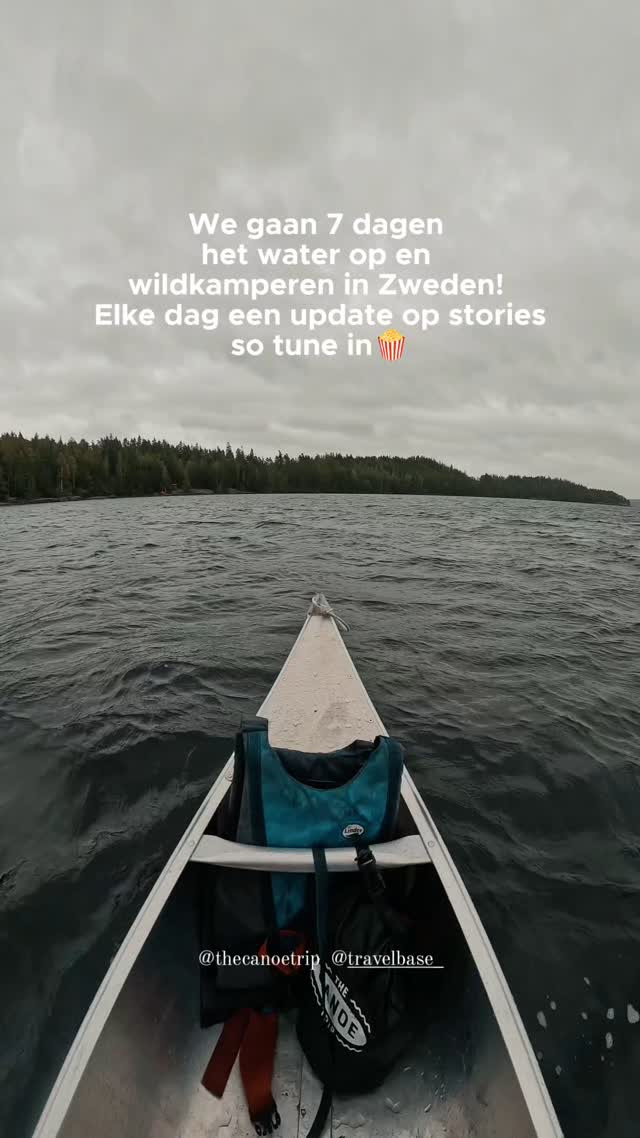
What are the results: The results show exceptionally high engagement through a massive series of 54 Instagram Stories, providing an authentic "behind-the-scenes" look at the daily life during the trip. In addition to the organic reach of the Reels and Facebook posts, we strategically published a follow-up post in October to drive pre-registrations, making the campaign bridge the gap between summer inspiration and autumn booking decisions.
Conclusion: The high volume of Instagram Stories (54) created an immersive narrative that allowed the audience to "travel along" in real-time, resulting in high brand trust and interest. By combining the emotional "high" of the trip in September with a tactical call-to-action in October, we maximized the conversion potential for the upcoming season. The content continues to perform as a long-term inspiration source through our blog and social channels.
Metrics and posts for each social media channel.
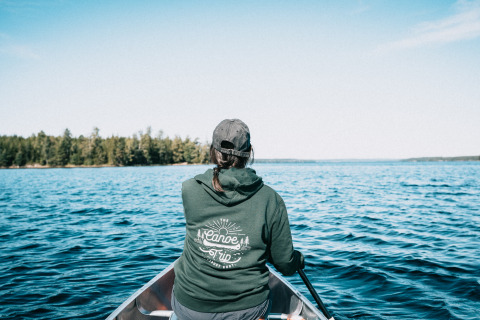
Een aantal dagen op kanotrektocht in de Zweedse natuur? Nooit gedacht dat wij dit zouden doen. Allereerst omdat wij vaker een middagje hadden gekajakt, en dat leek ons altijd leuk om te doen, totdat we op het water waren. Het is dan vaak winderig en dan vroeg we onszelf echt af: “Waarom wilden we dit
Updated 5 days ago
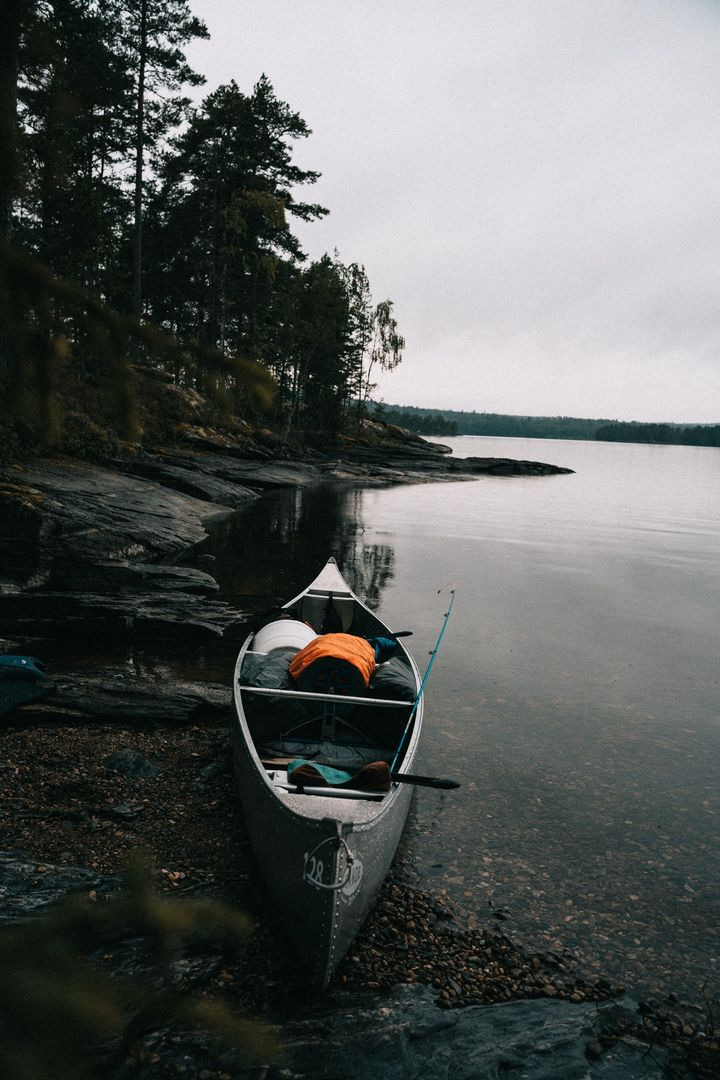
Wauw! Wij komen net terug van een 7-daagse kanotocht door Zweden. We wisten niet helemaal of het iets voor ons zou zijn, maar wat was dit The trip you didn't knew you needed. Hou je van trektochten maken, wil je even resetten (in de Zweedse natuur) en vind je het niet erg om te wildkamperen, actief bezig te z...
Updated 1 year ago
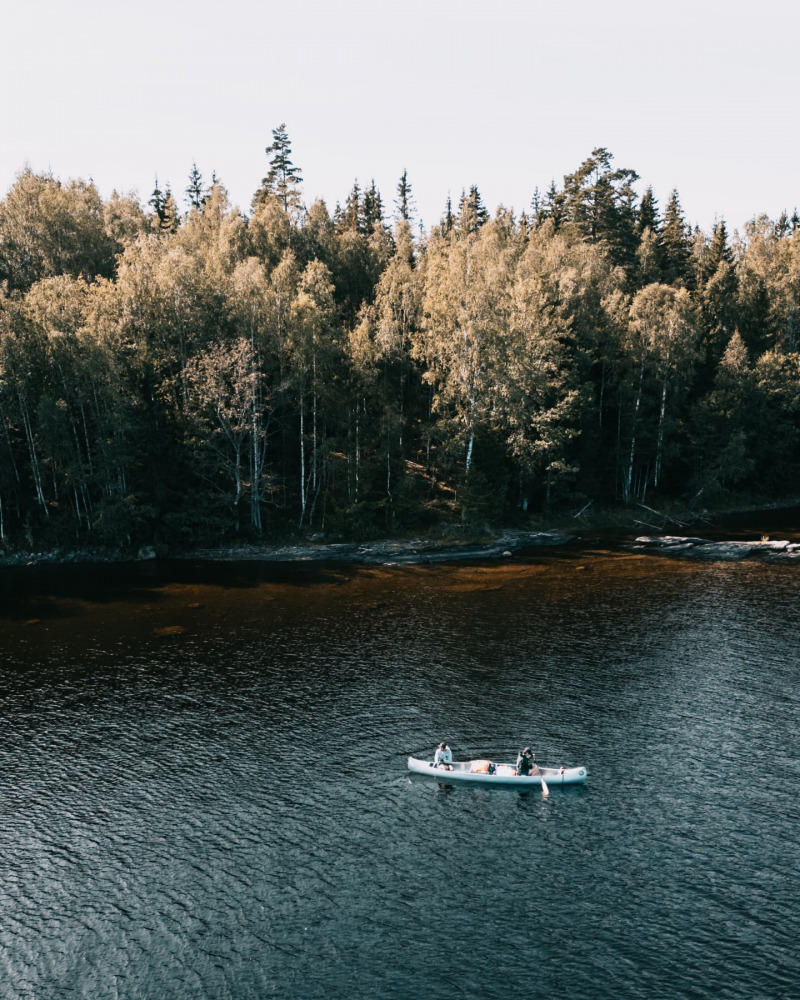
Weet je nog die toffe kanotrip die we in september maakten? Zin om dat volgend jaar ook te doen? Je kunt je NU vrijblijvend preregistreren bij @thecanoetrip voor meer informatie. Én je krijgt dan op 6 november een unieke boekingslink krijgt waarmee je kunt inschrijven – met 24 uur voorsprong op de rest van de...
Updated 1 year ago
Updated 1 year ago
Updated 1 year ago

Updated 1 year ago

Updated 1 year ago
Updated 1 year ago
Updated 1 year ago

Updated 1 year ago
Updated 1 year ago
Updated 1 year ago

Updated 1 year ago
Updated 1 year ago
Updated 1 year ago
Updated 1 year ago

Updated 1 year ago
Updated 1 year ago

Updated 1 year ago

Updated 1 year ago

Updated 1 year ago
Updated 1 year ago
Updated 1 year ago

Updated 1 year ago

Updated 1 year ago

Updated 1 year ago

Updated 1 year ago

Updated 1 year ago
Updated 1 year ago
Updated 1 year ago
Updated 1 year ago

Updated 1 year ago
Updated 1 year ago
Updated 1 year ago

Updated 1 year ago

Updated 1 year ago

Updated 1 year ago
Updated 1 year ago
Updated 1 year ago

Updated 1 year ago

Updated 1 year ago

Updated 1 year ago

Updated 1 year ago
Updated 1 year ago

Updated 1 year ago
Updated 1 year ago
Updated 1 year ago

Updated 1 year ago

Updated 1 year ago

Updated 1 year ago

Updated 1 year ago

Updated 1 year ago

Updated 1 year ago
Updated 1 year ago
Updated 1 year ago
Updated 1 year ago

Updated 2 years ago
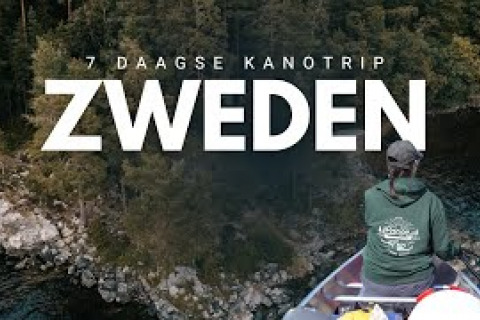
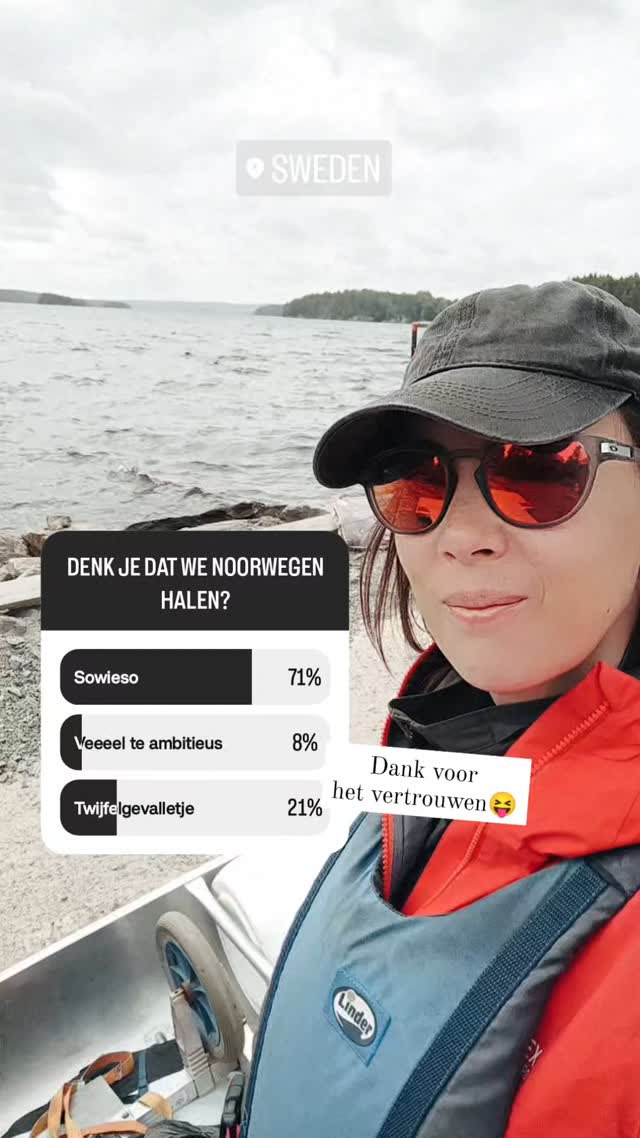
We ruilden ons comfort in voor een 7-daags avontuur in de Zweedse wildernis. Eén kano, twee peddels en één doel: de grens van Noorwegen bereiken. Dit is ons verhaal. Zin in jouw eigen avontuur? Wij deden The Canoe Trip van Travelbase. →https://thecanoetrip.com?a_aid=thelonedrifters&a_bid=7e55e566&data1=Yt&d...
Updated 5 days ago


