Report Metrics
Total report metrics. (YouTube Video Views and Instagram post Impression are included in Total Impressions.)
Total report metrics. (YouTube Video Views and Instagram post Impression are included in Total Impressions.)
Impressions & Engagement for each social media channel.
Report: DIVA-BOSS
Dates: 04 Feb. 2023 - 30 Jun. 2023
THIS REPORT IS FOR DIVA-BOSS COMPANY.
THE PURPOSE OF THIS. CAMPAIGN IS TO PROMOTE A NEW BUSINESS LAUNCH - TO BUILD BRAND AWARENESS
THE TARGET AUDIENCE FOR THIS CAMPAIGN IS FEMALE AND MALE 18- 45 YEARS OLD LIVING WORLD WIDE.
THE END RESULT OF THIS CAMPAIGN IS TO BRING 100K TRAFFIC TO THE NEW LAUNCH SITE
Metrics and posts for each social media channel.
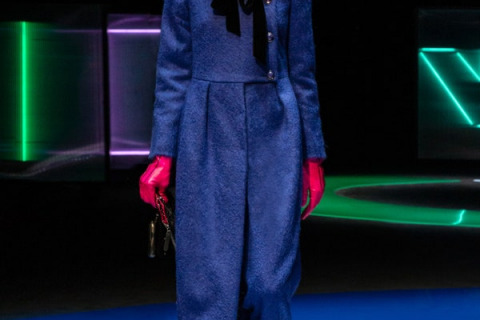
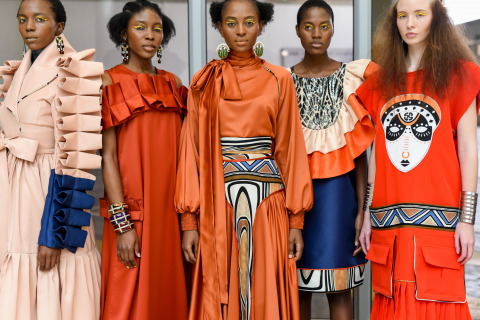
Italian Designer Giorgio Armani presented Emporio Armani’s 2021 fall-winter ready-to-wear collection titled In the Mood for Pop. The collection revisited the ’80s, particularly the time after the econ
Updated 2 years ago

RIHANNA is not only one of the best-selling singers of all time, but she is also an actress and entrepreneur. Since debuting in 2005, Riri has gone on to sell millions of records and start her own
Updated 2 years ago

There is no debate when it comes to Rihanna’s style. The business mogul and singer-songwriter has turned her personal brand into some of this generation’s most successful business ventures. Aside fro
Updated 2 years ago

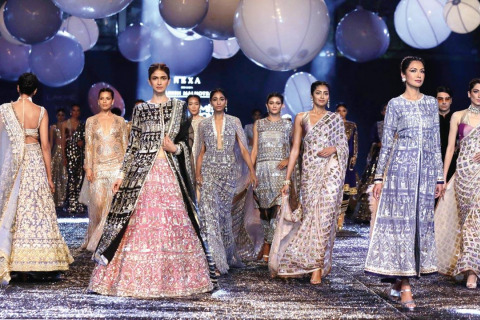
PARIS, FRANCE – FEBRUARY 25: A model walks the runway during the Saint Laurent Ready to Wear fashion show as part of the Paris Fashion Week Womenswear Fall/Winter 2020/2021 on February 25, 2020 in P
Updated 4 years ago

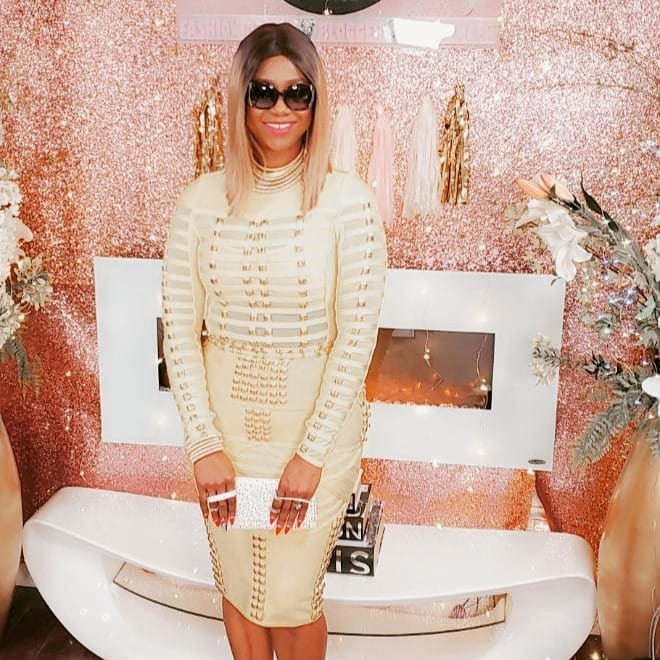
Hello Beautiful Divas! When Was the Last Time to REALLY, I mean REALLY TREAT YOUSELF? Lest You Forget! Allow me to remind of this: YOUR LIFE, YOUR RULES. , It's Time to " TAKE CONTROL" of it : PRIORITIZE YOURSELF, YOUR NEEDS, YOUR WANTS, YOUR LOOK, YOUR STYLES, YOUR BEAUTY. Let me Help you Unlock The Inner-Di...
Updated 4 years ago

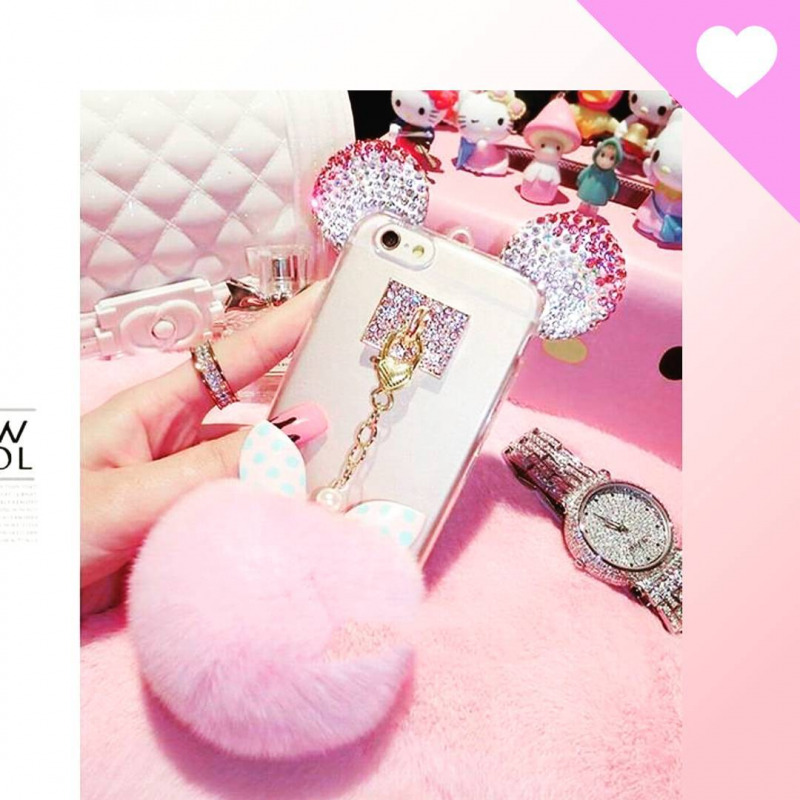
Hello Beautiful Divas! Lest We Forget! Allow me to Remind All Women Out There , Especially You who Are reading this message right this very second , How Powerful You Truly Are: You're : a Mom, a Wife, a Girlfriend, a Sister, a Student, an Aunt, a Niece, a Godmother, a Grandma, a Stepmom, a Cousin, a Best Fri...
Updated 4 years ago

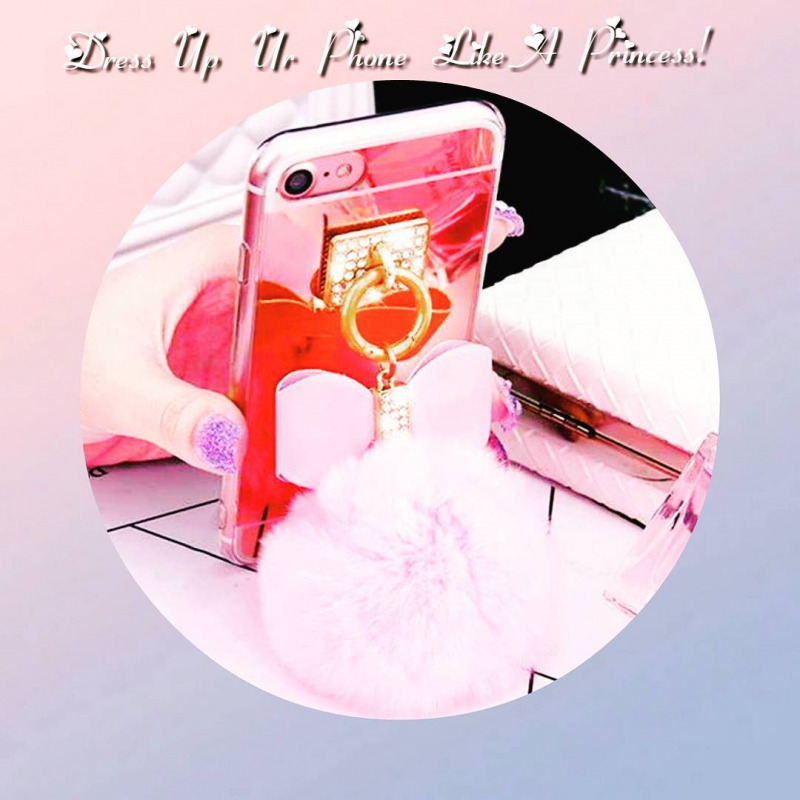
Real Proven Celebrity Fashion Styles on How to Look Expensive Subscribe Here: https://cutt.ly/UkQRcxS Curious to “UNLOCK ...
Updated 4 years ago

Curious to “UNLOCK MY DIVA WORLD”? Let's go behind the Scenes! www.dynaappolon.com/aboutme ♥Facebook Group: ...
Updated 4 years ago

Curious to “UNLOCK MY DIVA WORLD”? Let's go behind the Scenes! www.dynaappolon.com/aboutme ♥Facebook Group: ...
Updated 4 years ago